Infographics Explained: Top Tools to Create and Share Them Online
People do not read blocks of copy anymore, and NN Group found in 2019 that users read an average of about 20% of text on a page. When the audience uses scrolling as a new method to take in content even faster than breathing, infographics should not just be viewed as a “nice-to-have,” they should be viewed as a requirement.
Infographics are important in simplifying the complexities of the written word, raising awareness of your organization, and creating backlinks to your site.
Whether you are a top digital marketing agency in India ready to land global clients, or you are a mid-size brand in the US out to stand out among your competitors, online infographic makers have evolved into a much-used format.
In this blog, we will not cover the basics of infographics; instead, we will lay out tools, tactics, insider tips, and strategies to help to get your work awareness.
What is an infographic?
In the simplest infographic definition, a visual representation of information, data, or knowledge that is intended to quickly and clearly communicate information.
But infographics are more than just a nice picture. A good infographic integrates data visualization with a story and a call-to-action. Infographics take the information/data that is used and make it connect with people.
LinkedIn created a global Talent Trends Report infographic instead of a more traditional PDF. What did they learn? Engagement increased three times compared with the traditional PDF. People want simplicity; infographics create simplicity.
Types of Infographics
There are many types of infographics that have a variety of purposes, and it is important to select the type of infographic based on your overall goals, as the type of infographic will impact the messaging effectiveness over time:
- Statistical Infographics are great if you want to display a lot of data-heavy content. It is usually used for data like survey results and research results – a great way to enhance and show credibility and authority.
- Timeline Infographics are great to show a series of events, histories, or future plans. Timelines are great visual maps of before-and-after stories.
- Comparison Infographics are usually a “this vs that,” which can be especially helpful when providing product comparisons or service upgrades.
- How-To Infographics are methods of showing take through and guide through steps. Guides can be onboarding flows, taking you through how-to guides, or software as a service products.
- List-infographics create a compilation list that encourages and makes consuming text-heavy content on social media more engaging and easy to digest.
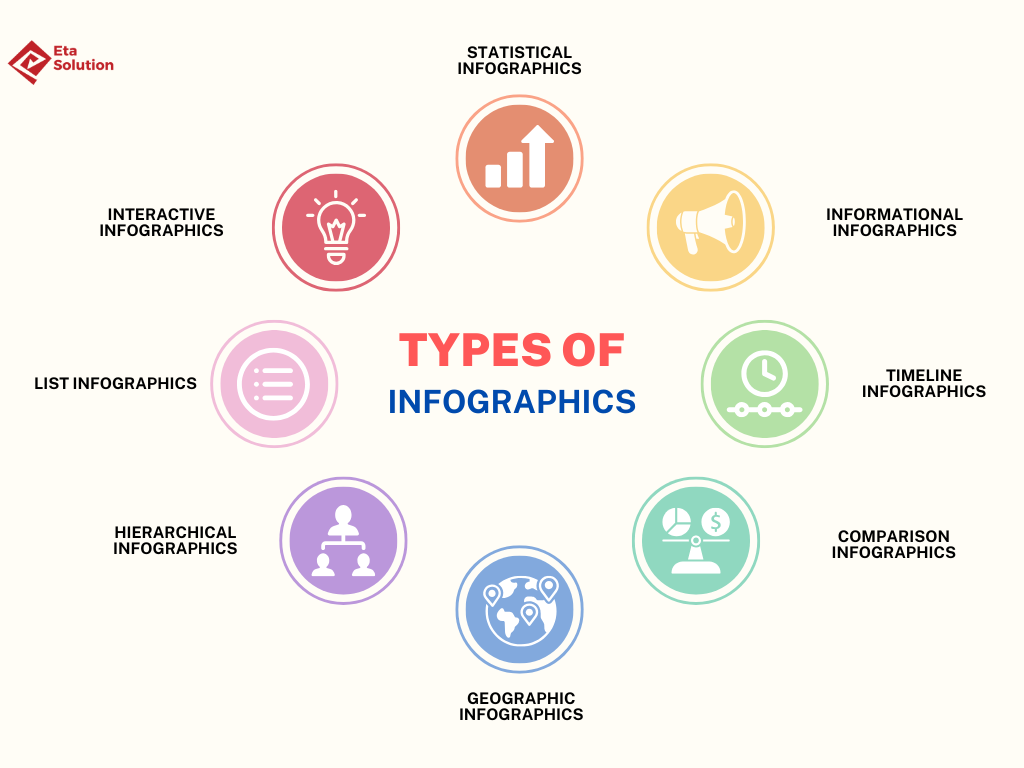
Many of the infographics that go viral are made of a combination of two or more of these examples, and combined with the design elements, you would classify them as hybrid infographics.
Benefits of Using Infographics
So why are marketers buying into infographics when everyone is now jumping on video and AI-generated content?
- Increased recall: When a visual element is introduced, people retain 65% of information, while just hearing or discussing the information increases their retention by only 10%
- Increased engagement: Visual aids get 94% more views than traditional text-only formats. Infographics offer rich visual anchors.
- SEO: Good infographics have the potential to generate 178% more backlinks than a blog post.
- Repurposing: A single infographic can be converted into what’s called ‘spin-offs’ or repurposed for an email header, Pinterest pin, Instagram carousel, or slide deck on a variety of social media platforms.
- Increased lead conversion: Unbounce has found that adding infographics to a landing page could increase conversions by as much as 30%.
The takeaway? Infographics are not just informing, they are performing.
Elements of a Great Infographic
An infographic should be clear, useful, and eye-catching. The following are crucial factors to take into account:
- A Clear Core Message: The main question your infographic attempts to answer should be addressed. Avoid packing too much into one area.
- Visual Hierarchy: Choose the infographic’s frame and use font size, color contrast, and placement to guide viewers’ eyes.
- Reliable, Correct Information: Cite your sources. Your brand will suffer from inaccurate or deceptive information.
- Whitespace or Breathing Space: Visual clutter can be extremely distracting. The audience can concentrate when layouts are neat and orderly.
- Brand Integration: Use your call-to-action to inform customers of what to do next, along with your logo and brand colors.
When successfully executed, infographic design is a balance of data meets art that informs and converts.
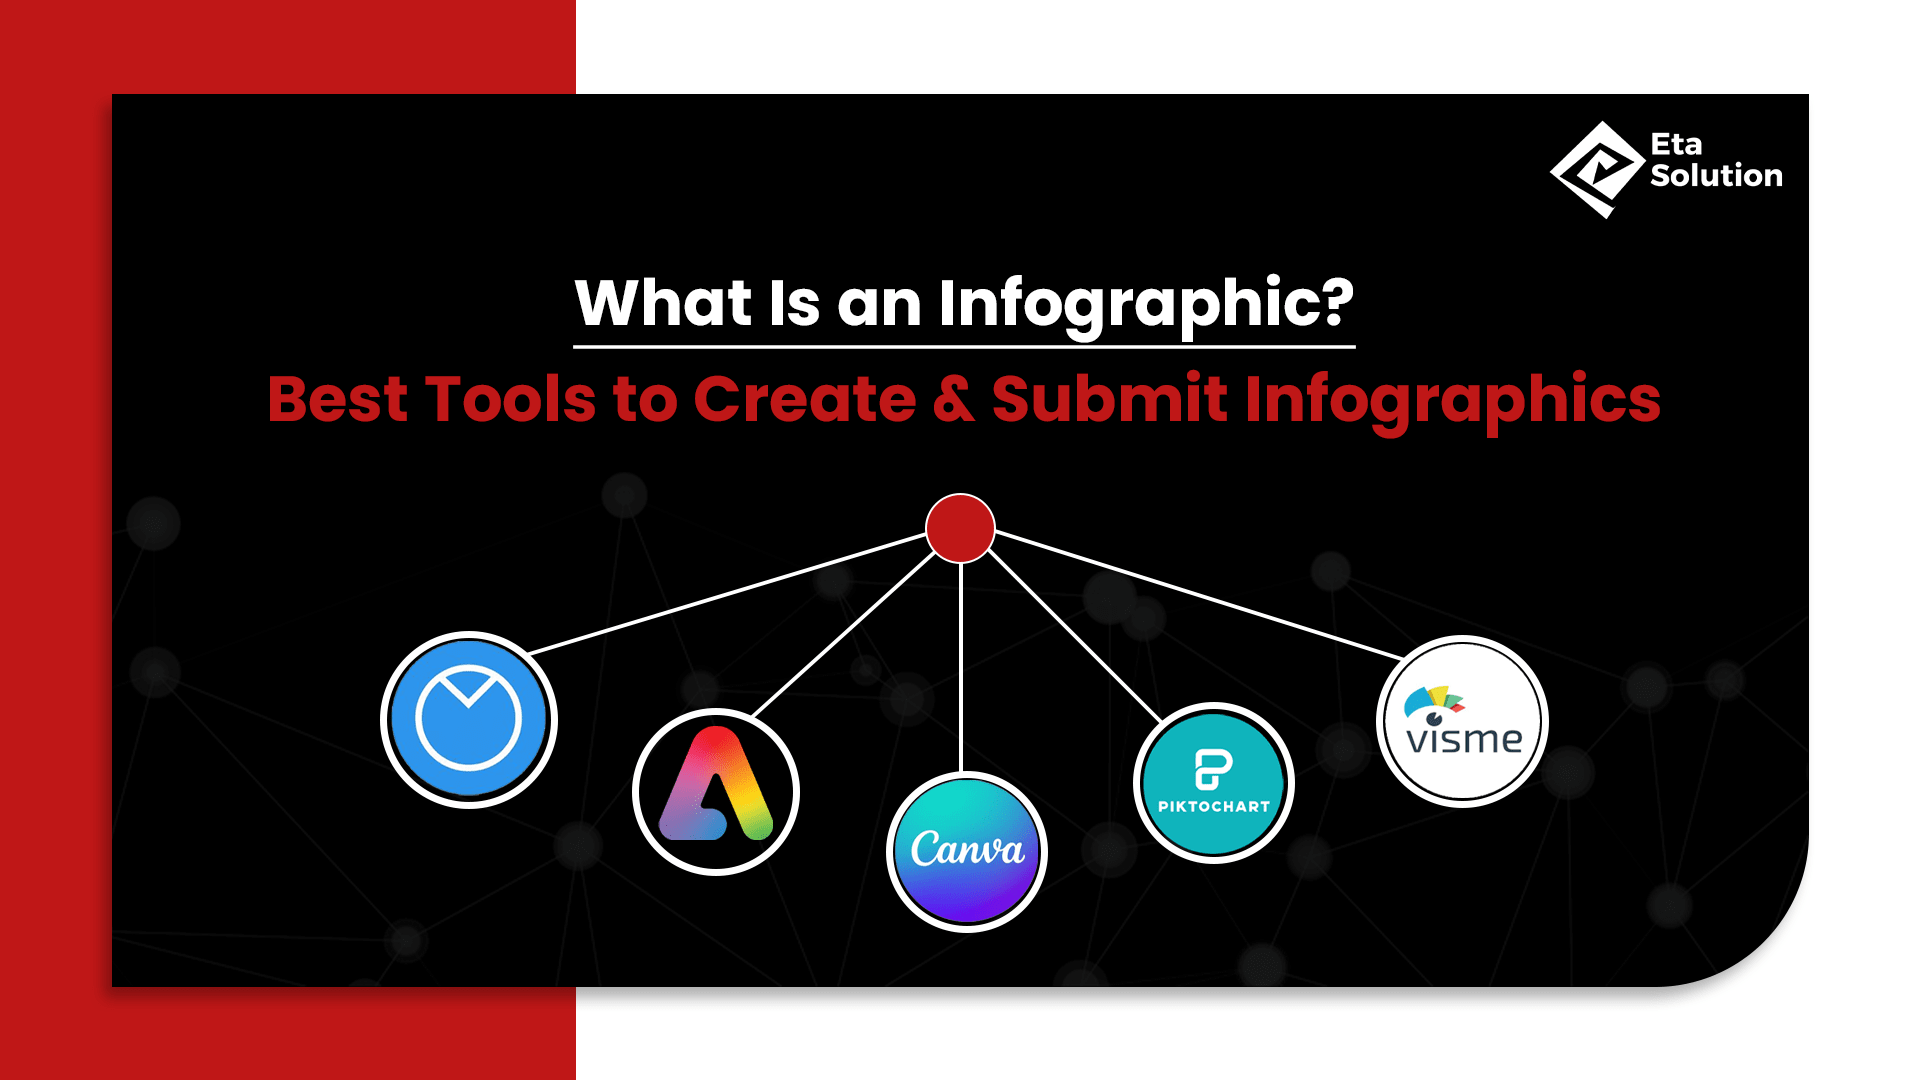
Best Tools to Create Infographics
When looking for infographic tools, depending on your use case, your design skills, and branding requirements, the options vary. Here are a few reputable companies and user-friendly platforms:
1. Canva
Canva is great for novices and non-designers. They offer thousands of designs with business-specific branded templates, a drag-and-drop interface, iconic illustrations, and a lot of choices, so you can create infographics that are professional and clean in as little time as you have. “Infographic in Canva” is among the most populated search queries for solopreneurs.
2. Piktochart
Piktochart is designed for data stories, and you can easily convert the data in your spreadsheets to graphics. Piktochart is generally popular in education, and for non-profits and research-related industries.
3. Visme
Visme is a very popular choice for marketers looking to manage brand consistency. Visme also has the ability to offer animations and interactive elements for teams, and also integrates with most other Content marketing tools.
4. Adobe Express
For those comfortable with the Adobe ecosystem, Express allows for greater control over fonts, effects, and exports. Great for tailored brand-specific infographics.
5. Venngage
Built for teams, Venngage walks you through professional-level templates by industry and use case. Venngage also allows you to use brand kit integrations to keep all output consistent.
All of the above infographic builders are equipped with free versions, but consider premium plans to preserve brand integrity and advanced exports.
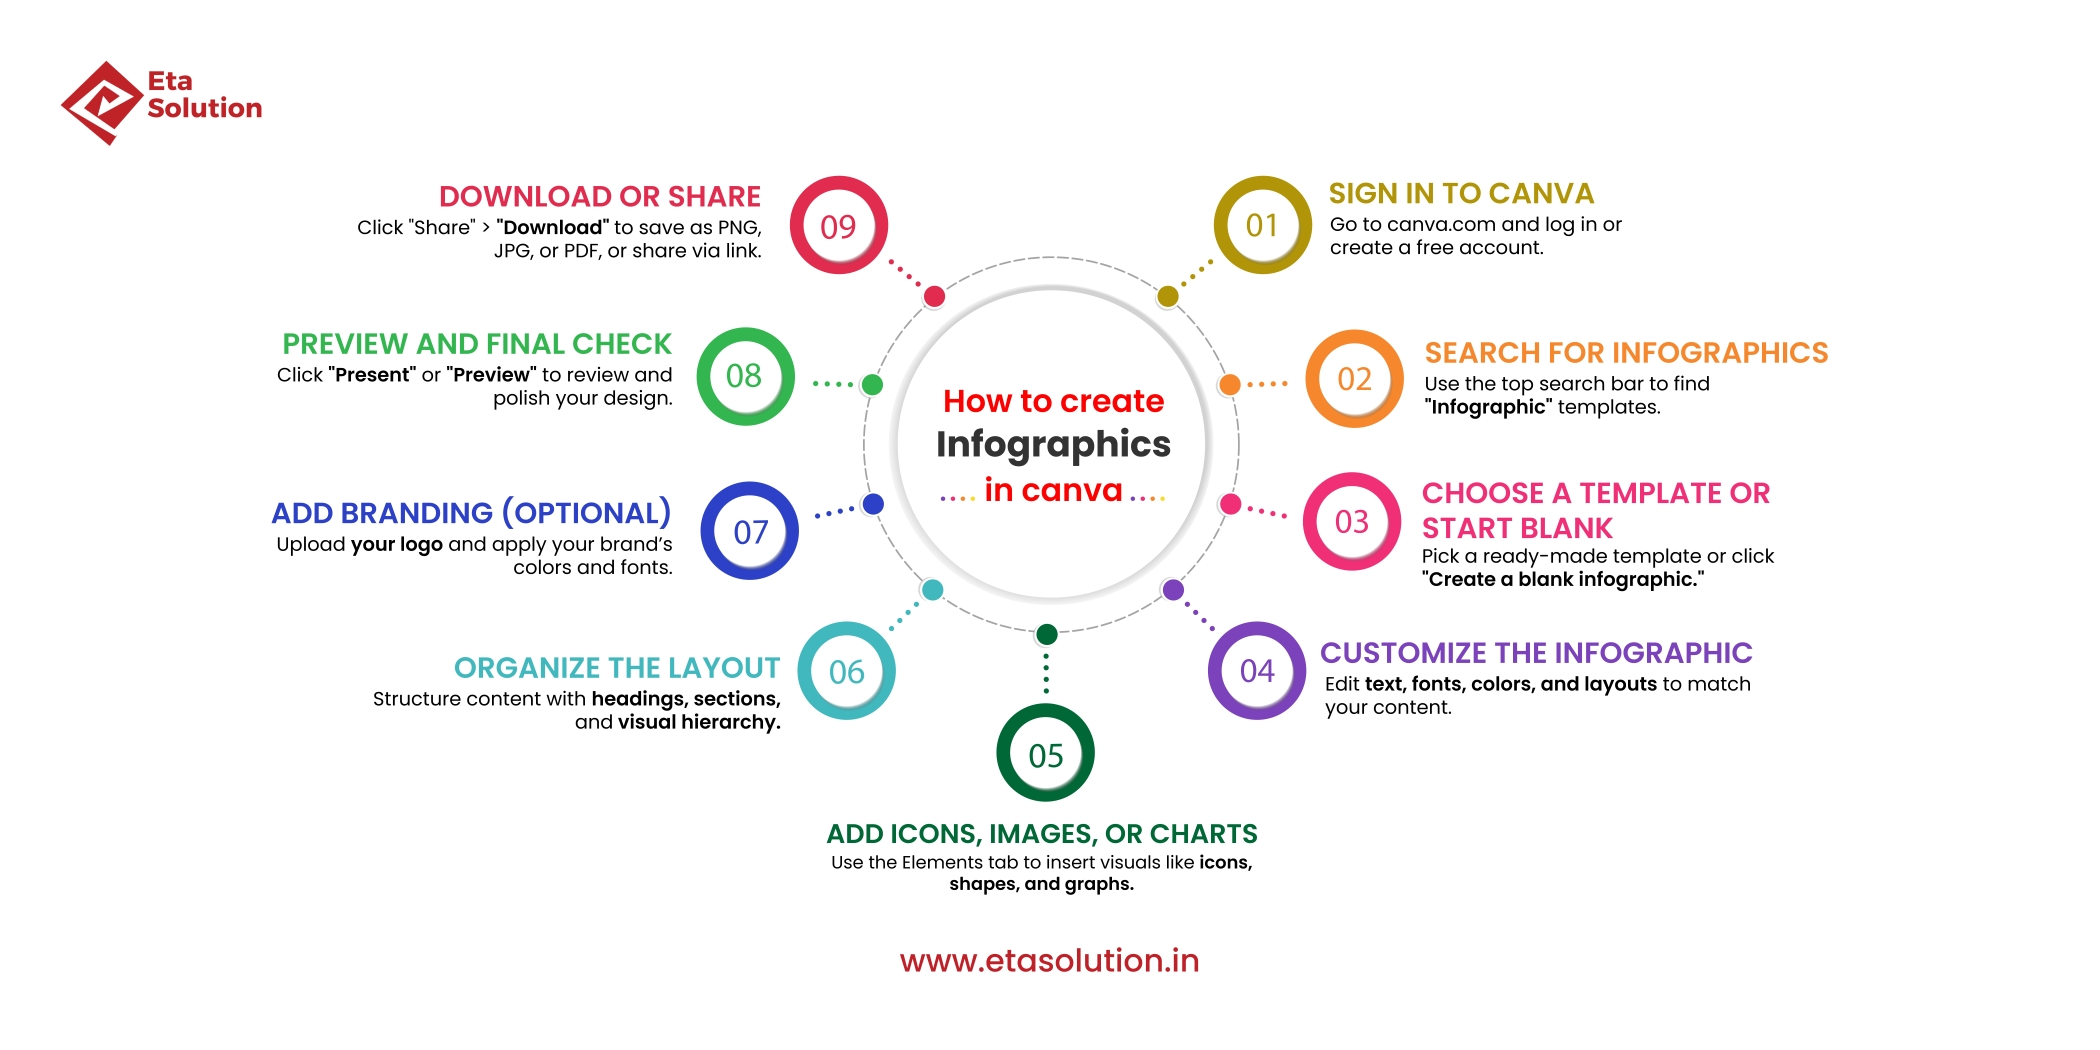
How to create infographics in canva
Tips for Designing Effective Infographics
Designing isn’t just about looking good; it’s about usability. Here are insider tips used by expert teams:
- Use a Color Palette: A limited and consistent color palette means less unnecessary clutter and more branding effort.
- Use only 2 Fonts at Most: Keeping the design limited to 2 fonts keeps the design readable and looking professional.
- Use Icons instead of Stock Images: Icons hold better scalability and communicate faster, especially while on mobile.
- Compress Files: Large files slow down loading times and have an impact on SEO, among other things. Make use of a file optimization tool, such as TinyPNG.
- Constantly Mobile-Test: You want to make sure that your designs appear as crisp on mobile devices as they do on a monitor, since over 70% of visual content is viewed on mobile devices.
Design is a language. It speaks louder than words when done correctly.
How to Submit and Share Your Infographic
Now comes the overlooked part: distribution. Creating is just 50% of the work.
To effectively submit infographics, you need a multi-channel strategy:
- Pinterest: With 450+ million monthly users, it’s a goldmine for evergreen traffic.
- Reddit: If your infographic is data-rich and non-promotional, it could gain massive visibility.
- Visual.ly and Infographic Journal: Though older platforms, they still provide SEO value and authority.
- SlideShare and LinkedIn Carousels: These are underutilized for B2B. They offer a native, swipeable experience for infographics.
- Medium: Embed your infographic into contextual posts and link back to your website for referral traffic.
One inside tip from a top digital marketing agency in India: Pair infographic submission with influencer outreach. A single repost by a niche thought leader can double your impressions.
Infographic SEO: What You Need to Know
Infographics need SEO attention too. Here’s how to maximize their discoverability:
- Descriptive Filenames: Use keywords in your image filename. Avoid generic titles like “image1.png.”
- Alt Text Matters: Alt attributes help with image indexing and accessibility.
- Use Schema Markup: Add ImageObject structured data to help Google understand and rank your visuals.
- Host on Your Domain: Infographics that are hosted on non-owned CDNs will not help with our site’s SEO.
- Provide Context: Surround your infographic with optimized blog content that includes keywords like “create infographics” and “content marketing.”
Don’t skip these. They’re not optional anymore.
Common Mistakes to Avoid
Here are five errors marketers continue to make with infographics:
- Excessive Text: Infographics are not meant to duplicate blog posts; rather, they are meant to simplify them. Make very little use of copy.
- Absence of source attribution can damage your data’s credibility and render it uncheckable.
- Lack of Mobile Optimization: An eye-catching infographic on a desktop computer might not work well on a smartphone.
- Lack of a Clear Call to Action: Always be aware of what you want the audience to do next, be it downloading a resource or visiting another website.
- Overuse of Pie Charts: Although visually appealing, pie charts are not reliable for in-depth comparisons. Instead, use line or bar graphs.
Avoid these, and your infographic will not only look good but perform well.
Best Infographic Submission Websites
Not all directories are created equal. Here are trusted platforms you can use:
Platform | Domain Authority | Submission Type |
Visual.ly | 80+ | Manual |
Infographics Archive | 70+ | Free & Paid |
Reddit (r/infographics) | 90+ | Community (strict) |
95+ | Board-based sharing | |
SlideShare | 92+ | B2B Friendly |
Infographic Journal | 60+ | Approval-based |
Platform selection should be based on your target market. Submission is about visibility in the right places, not just backlinks.
Concluding remarks
Infographics give your message visual weight and shareability in a world where content is abundant. They can help you build topical authority in your niche, convert better, and get shared more often. Compared to infographics, inmate content strategies yield higher returns on investment. Because infographics offer one of the best returns on investment (ROI) for content marketing today, if you’re the Top Digital Marketing Agency in India, creating global content strategies, or growth hacking the startup world to gain exposure, you’re way ahead of the game.
The value isn’t just in creating them, it’s in how smartly you distribute and optimize them. So next time you brainstorm a content piece, ask yourself: “Can this be visualized?” If yes, it’s infographic time.